eLuminate, eGenerationMarketing’s case and lead management software, was designed to help attorneys boost profitability and streamline the process of signing a client and winning a case. With eLuminate, you can generate customizable documents, send mass emails, and even delegate tasks to other members of your firm.
But some of the most insightful components of eLuminate are graphs and summary tables. With these reports, you can identify which cases your firm is successful with, and where there is room for improvement.
When you create custom views and fields in eLuminate, you will be able to use charts and summary tables to better understand your firm’s successes with your leads and cases. It is important to note that these reports are only generated within a specific view in eLuminate. Feel free to speak with Client Services about how to customize views and fields in eLuminate to best suit your firm.
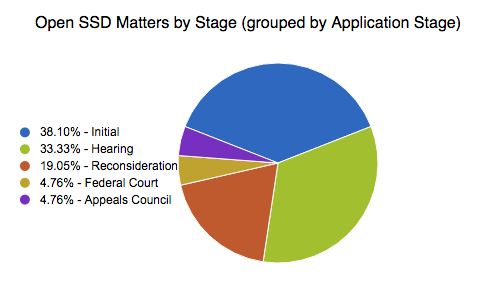
For example, let’s say you’re a Social Security disability attorney using eLuminate to manage your cases. You would likely be interested in using the pre-installed view Open SSD Matters by Stage. This view will allow you to see how many cases you have by stage of application, from Initial to Federal Court.

In this example, we can see that this firm has a pretty even number of cases pending at both the Initial stage and at the ALJ Hearing. This is important for your law firm to track because it will allow you to know where to focus your resources. A firm like this will need to employ an even number of attorneys and intake staff to keep up with the pending cases. If your firm has significantly more cases at the ALJ Hearing than the Initial stage, you know you will need to have more attorneys on hand to take on cases than you will need intake staff.
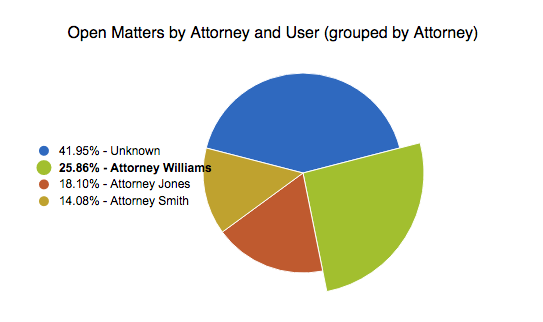
Another important view for utilizing graphs is Open Matters by Attorney and User. This will display a list of cases by attorney and eLuminate user in charge of the case.

In this instance, we can see that 41% of cases have not been assigned an attorney, and Attorney Williams is currently handling the most cases with 25.86%. This is an important visualization because it allows your intake staff to easily determine which attorney should take a case that’s going to trial. Attorney Smith has the fewest cases, so it would make the most sense to give him the next case so as to not overwhelm the rest of the firm’s staff.
Keep in mind that you can create a custom view to create lists of whatever you want. You can create pie charts to see how many personal injury cases you’ve won by case type, how many leads your intake staff is handling, and more. Whatever metric is critical for your firm’s success, you can track it in eLuminate. If you’d like to discuss how eLuminate can help your firm, give us a call today at 617.800.0089. Client Services can set up a tutorial with the members of your firm to demonstrate eLuminate’s features and how it can be used in coordination with your lead generation package.